County Financial Data
Dashboard Instructions
Dashboard of County Financial Data
Jump to Dashboard
The interactive dashboard at the bottom of this page shows audited financial data for all 95 Tennessee Counties, including distress metrics, for consecutive fiscal years starting from 2007.
To use the dashboard, select a County from the drop-down menu in the upper left corner of the screen. The information will update for the selected County across the first three tabs of the dashboard. You can toggle between the tabs by clicking on the < or > arrows at the bottom of the dashboard screen.
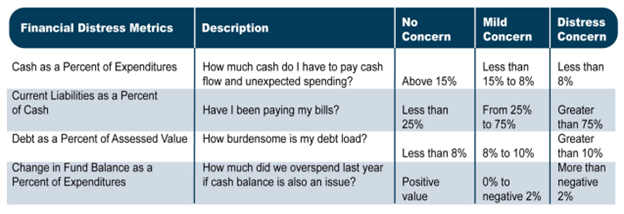
- The first tab highlights individual audit year data and distress metrics. You can toggle between audit year and selected funds. (See below for definitions of Distress Metrics from the Comptroller’s Debt Manual.)
- The second tab displays four financial distress metrics for a selected county and the State average for all counties for the selected year and fund.
- The third tab displays a historical look at a county’s total inflows and outflows of resources for the period as bar charts along with fund balance and cash balance shown as line charts. A slider at the bottom of the page can reduce the range of years.
- The fourth tab displays a bubble chart of distress metrics. Choose from a debt metric on the X-Axis and one for the Y-Axis for comparative analysis. The color of the bubble highlights the tax rate of the county.
Financial Health Metrics
Financially healthy local governments tend to have a few traits in common—they operate with balanced budgets, do not spend nonrecurring funds on recurring expenses, maintain adequate cash reserves, have a manageable debt burden, and keep liabilities in check. Local governments that do not manage these items tend to experience financial issues that show up in the following metrics that the Comptroller’s Office calculates annually:

Back